Analytics

Learn how to monitor usage, performance, and request behavior for your Stook Buckets using Stook Analytics in the Medianova Control Panel.

Stook Analytics provides detailed visibility into how your Stook Object Storage buckets are used, accessed, and performing over time.

It aggregates request-level data generated by Stook API operations and presents them as charts, KPIs, and raw logs to help you monitor traffic, performance, and reliability.

You can access Stook Analytics from the Medianova Control Panelarrow-up-right or programmatically via the Stook Analytics API.

Stook Analytics
circle-check
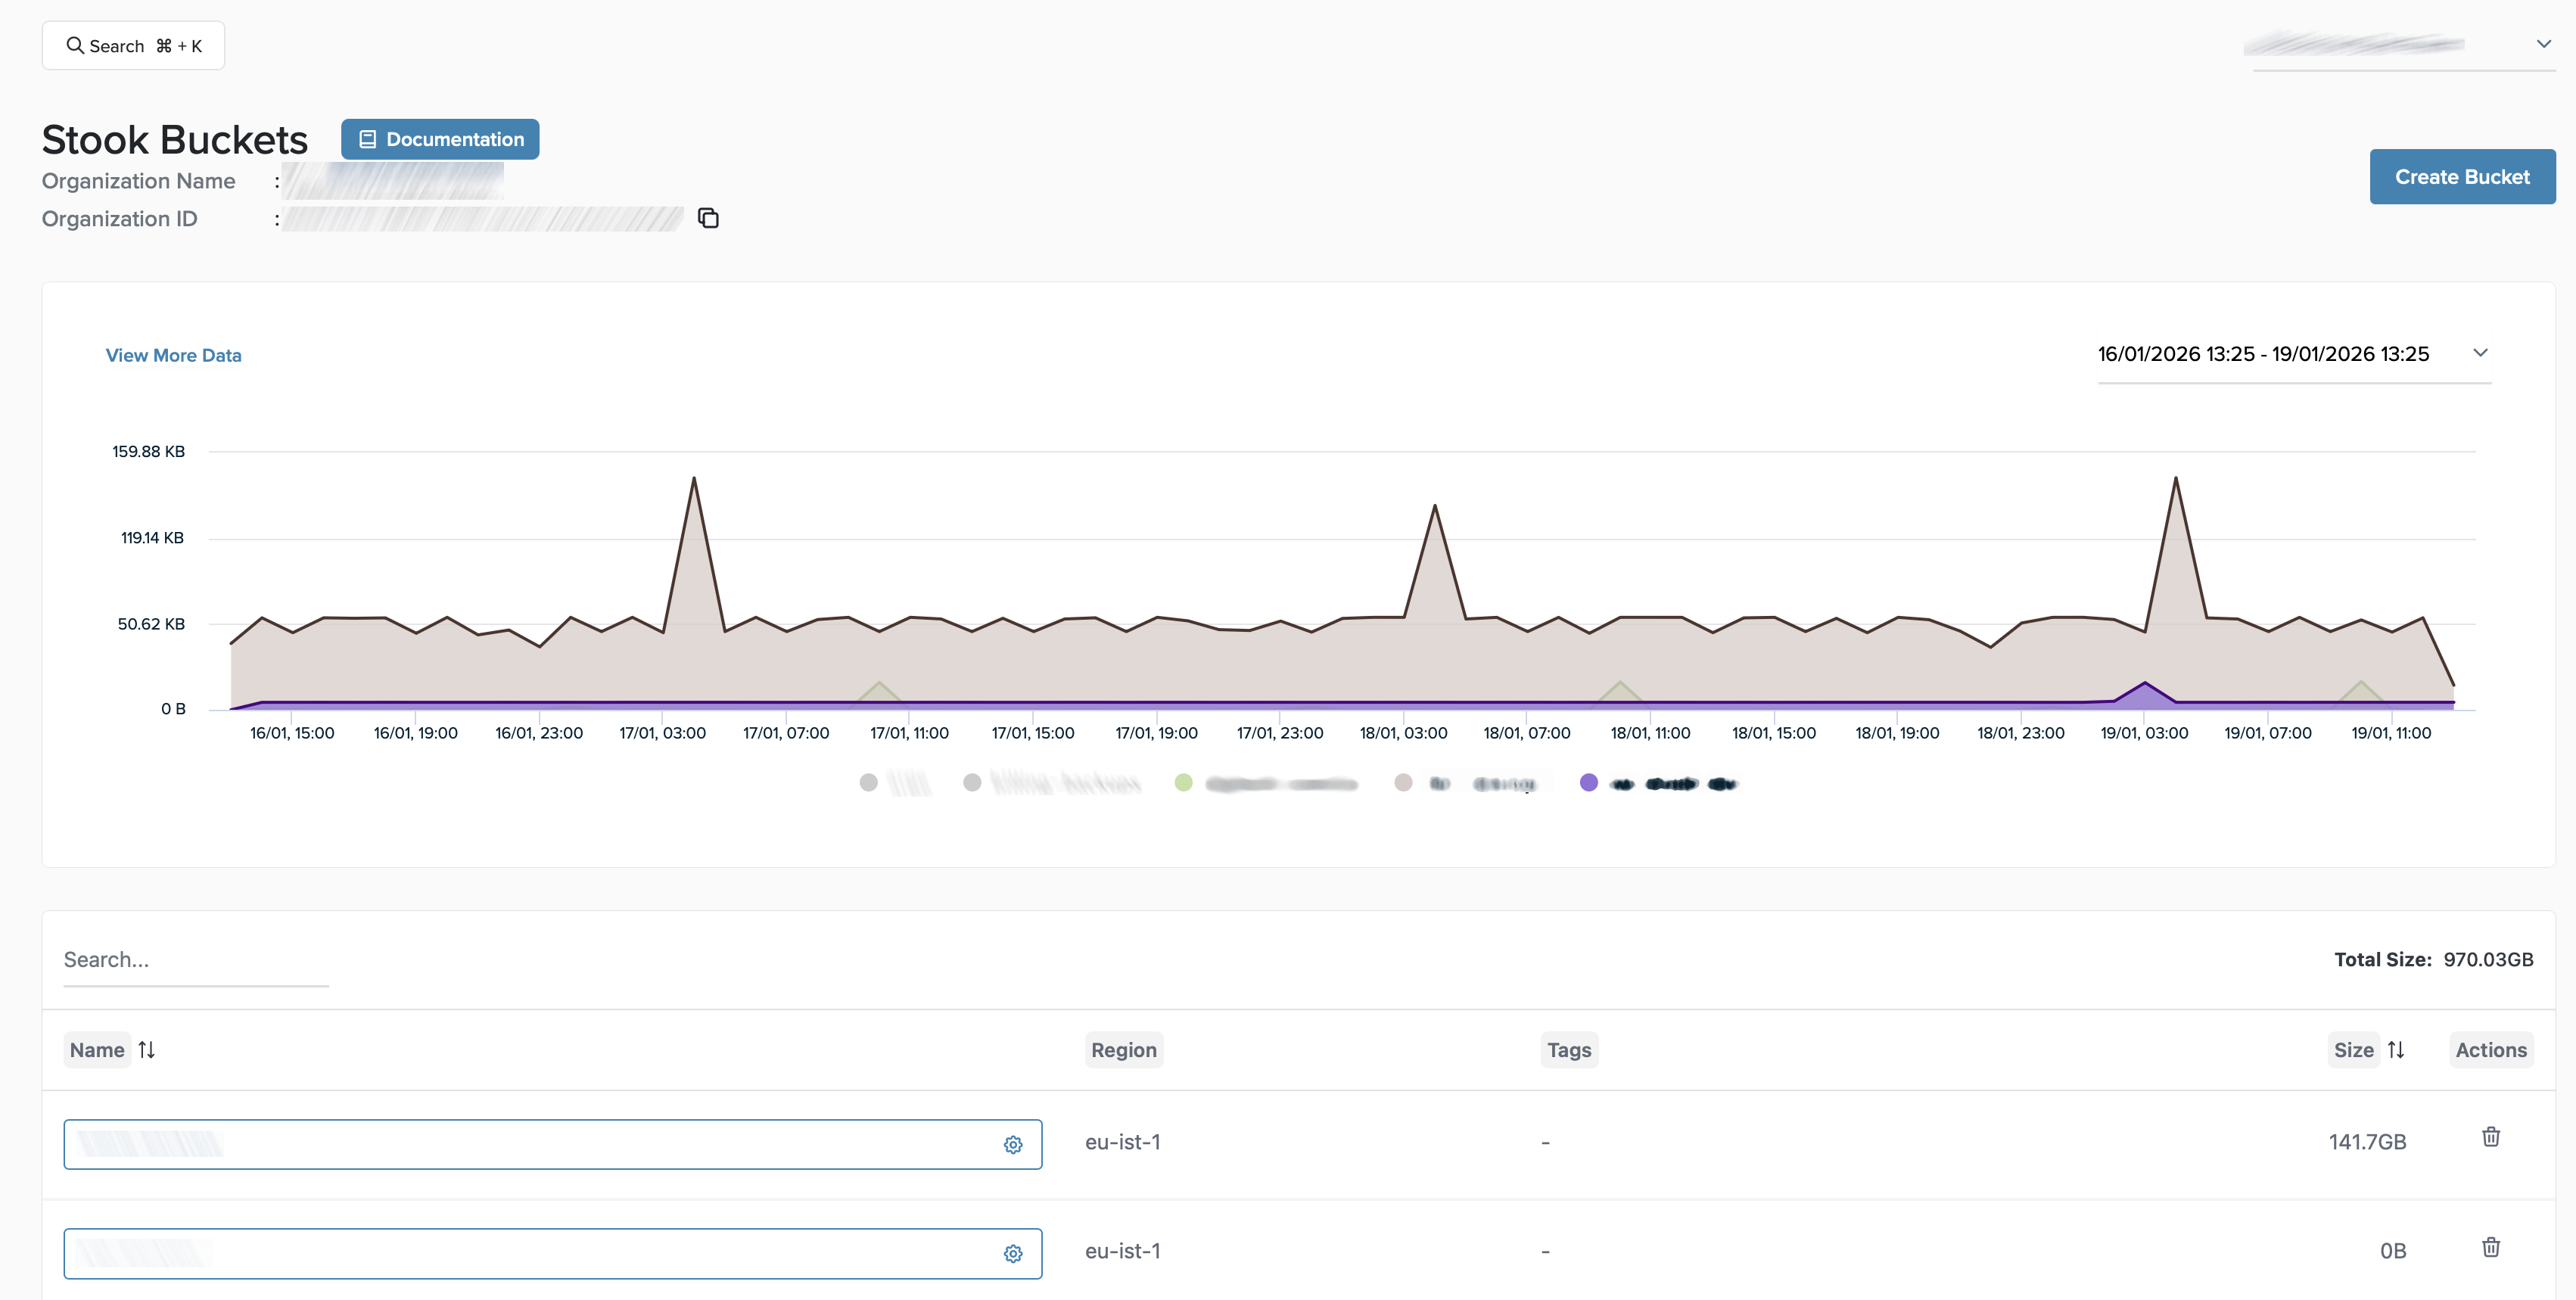
Analytics preview displayed on the Stook Buckets page

Filters and Time Range

Use filters to narrow down analytics data and focus on specific buckets, operations, or traffic characteristics.

circle-info

Analytics queries support a maximum time range of 90 days per request. For longer analysis periods, split your queries into multiple date ranges.

Use filters and metric selectors to refine analytics data by bucket, operation, and time range.

You can filter analytics data by:

  • Bucket – View metrics for one or more Stook Buckets

  • Metric type – Switch between Requests, Bytes, Throughput, IO Rate, and Average Response Time

  • API operation – Filter by Stook API actions such as GetObject, PutObject, or ListObjectsV2

  • Status code and response type – Analyze successful and failed requests

  • Geography and endpoint – Inspect traffic by country or request host

Add filter options for advanced traffic analysis

Select a custom time range to analyze historical data. All charts and tables update automatically based on the selected period.

circle-info

FTP uploads are not included in Stook Analytics.

Data retention policy

circle-info

Stook Analytics retains historical analytics data for up to 6 months.

Charts, tables, and raw logs may return partial or empty results when querying dates outside the retention period.

Key Metrics Overview

At the top of the Analytics page, Stook Analytics provides a summary of key metrics for the selected scope and time range.

Key metrics and request distributions provide a high-level overview of usage, performance, and reliability.

These metrics include:

  • Total Requests – Total number of API requests processed

  • Total Bytes – Total amount of data transferred

  • Average Response Time – Average request processing duration

  • Total Stored Data – Current storage usage across selected buckets

  • Success Rate – Percentage of successful requests

  • Failure Rate – Percentage of failed requests

  • Upload and Download Requests – Number of upload and download operations

This overview helps you quickly assess usage, performance, and reliability.

circle-info

For detailed explanations of each metric and how they are calculated, see the Metrics page.

Traffic and Request Analytics

Request volume visualized over time, by bucket, and by endpoint.

Requests over time

Visualize how request volume changes over time to identify traffic patterns, peaks, or unexpected drops.

Requests per bucket

Break down request volume by bucket to understand how traffic is distributed across your Stook Buckets.

Requests per endpoint

Analyze request volume per endpoint to identify the most frequently accessed hosts.

Distribution Insights

Distribution of requests by API operation and geographic location.

Requests per method

View the distribution of Stook API operations, including:

  • GetObject

  • PutObject

  • ListObjectsV2

  • DeleteObject

  • HeadObject

This view helps you understand how applications interact with your stored objects.

Requests per country

Analyze the geographic distribution of requests based on country codes.

Error Analysis

Client-side and server-side error ratios visualized over time and across buckets.

Error ratio

Track client-side (4xx) and server-side (5xx) error ratios over time.

Failure rate per bucket

Compare failure rates across buckets to identify configuration issues or abnormal request patterns.

Bucket Details

The Bucket Details table provides a bucket-level summary, including:

  • Request count

  • IO rate

  • Total bytes transferred

  • Throughput

  • Success rate

  • 4xx and 5xx ratios

This table enables quick comparison of performance and reliability across buckets.

Bucket-level summary of request volume, throughput, and error ratios.

Raw Logs

The Raw Logs section lists individual request records for detailed inspection and troubleshooting.

circle-info

Raw log queries follow the same time range and data retention limits as other analytics views.

Detailed request logs for inspection and troubleshooting.

Each log entry includes:

  • Timestamp

  • Bucket name

  • API operation

  • Status code

  • Request host and path

You can open a log entry to view full request details, performance metrics, and client information.

FAQ

Why can I only query up to 90 days of data at once?

To ensure consistent performance and predictable response times, Stook Analytics limits each analytics query to a maximum of 90 days. If you need to analyze a longer period, split your request into multiple date ranges and combine the results.

How long is analytics data retained?

Stook Analytics retains historical analytics data for up to 6 months. Queries outside this retention window may return partial or empty results, depending on data availability.

Are all Stook operations included in analytics and raw logs?

Stook Analytics includes request-level data generated by Stook API operations such as object access, uploads, downloads, and metadata requests. FTP uploads are not included in analytics metrics or raw logs.

API Access

For automation, integration, or custom monitoring workflows, Stook Analytics data can be retrieved programmatically.

See the Stook Analytics API Reference

Last updated

Was this helpful?