Dashboard Library

Learn how to explore and interpret the dashboards available in MN Logz Analytics.

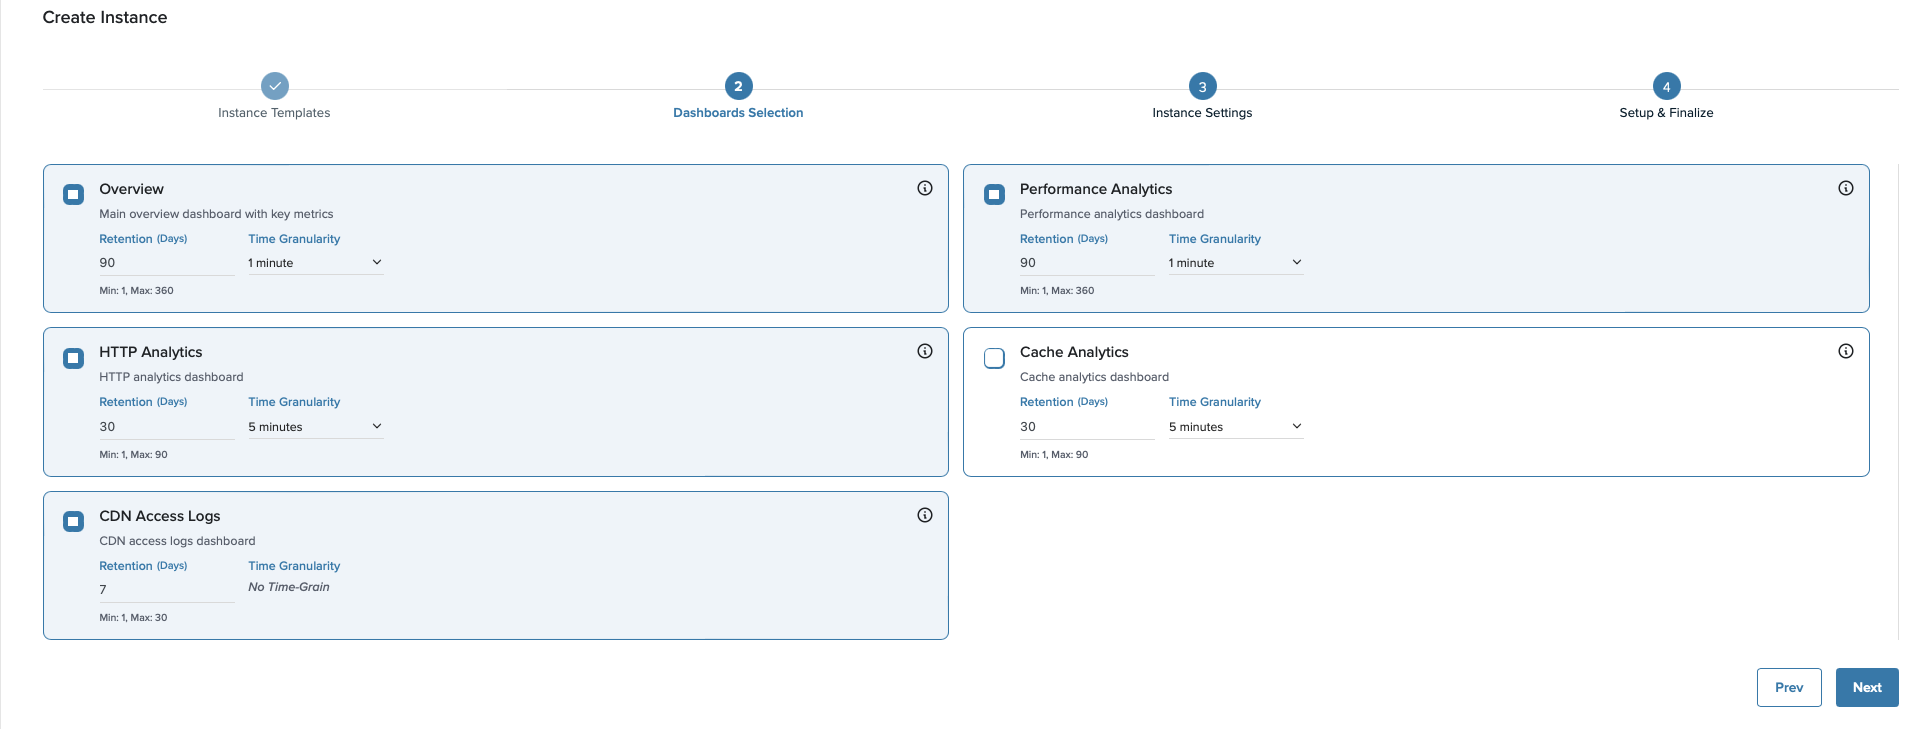
The Dashboard Library is the core interface of MN Logz Analytics. It offers a collection of pre-configured Grafana dashboards designed to visualize CDN traffic in real time. Each dashboard helps you monitor performance trends, cache efficiency, geographic distribution, and client behavior — all within a secure, isolated Grafana environment.

Use the Dashboard Library to:

  • Track end-to-end CDN and edge performance.

  • Identify latency or cache-related issues.

  • Visualize traffic flow across countries and data centers.

  • Drill down into specific requests or error events.

Before You Begin

Before accessing dashboards, ensure the following prerequisites are met:

  • Your MN Logz Analytics instance is active and accessible from the Medianova Control Panel.

  • Data ingestion from your CDN resources is properly configured and active.

If no data appears, confirm that your dataset retention and traffic volume meet your analytics configuration.

Access Dashboards

Go to Medianova Control Panel and select your MN Logz Analytics instance.

1

Open the Dashboard Library

From the left-hand menu, click Dashboard Library to view available dashboards.

Dashboard Library

Start with the Overview Dashboard to get a quick snapshot of overall performance, then move to Performance or Cache Analytics for deeper diagnostics.

2

Select a Dashboard

Choose a dashboard to begin analyzing metrics.

All dashboards use consistent filter types (Resource, Country, Status), making it easy to cross-compare data between dashboards.

Each dashboard opens in a dedicated Grafana view with interactive filters.

Dashboards

Dashboard
Description
Key Insights

High-level summary of CDN traffic, cache ratio, and errors.

Global performance overview.

Analyzes latency, RTT, and datacenter behavior.

Request time and network efficiency.

Provides detailed view of user access, referers, and devices.

User behavior and traffic origins.

Measures cache efficiency by content type and device.

HIT/MISS ratios and optimization insights.

Displays request-level raw logs for full traceability.

Deep troubleshooting and verification.

FAQ

Can I create my own dashboards? Currently, users can request custom dashboards through Medianova Support. Future releases will include user-defined dashboard templates.

Are dashboard filters synchronized? Filters are applied per dashboard, but similar filter types (e.g., Resource, Country) maintain consistent behavior across all dashboards.

Can I access dashboards outside the Control Panel? Yes. Each MN Logz Analytics instance has its own Grafana domain (e.g., https://<INSTANCE>.mnlogz.medianova.com) with secure role-based access.

Last updated

Was this helpful?